


What is the significance of this?
- Complete Infrastructure as Code: Provision entire AWS EKS cluster and all platform services with a single command
- GitOps Automation: ArgoCD automatically deploys and manages all platform applications from Git repositories
- Production-Ready Platform: Comprehensive observability stack with monitoring, logging, and testing tools
- High Availability: Multi-AZ deployment with auto-scaling worker nodes and Horizontal Pod Autoscaler (HPA)
- Zero-Downtime Deployments: Kubernetes rolling updates ensure continuous service availability
- Complete Observability: Prometheus, Grafana, Loki, and Promtail for metrics, logs, and dashboards
- SRE-Ready: Availability testing and sanity checks built-in
How is automation accomplished?
- Terraform Infrastructure: Complete AWS infrastructure provisioning (VPC, EKS, IAM, Security Groups) as code
- Docker Containerization: Terraform runs in Docker for consistent execution across team members
- Helm Charts: Application deployment automation with Helm templates and values management
- ArgoCD GitOps: App-of-apps pattern automatically deploys entire platform toolkit from Git
- Makefile Automation: One-command deployment (
make deploy) for entire infrastructure stack - Auto-Scaling: HPA for pod scaling and AWS Auto Scaling Groups for worker node scaling
- Automated Sync: ArgoCD continuously syncs Git changes to cluster with self-healing capabilities
Prerequisites
- AWS Account: Programmatic access with IAM user
- IAM Policies: AmazonEC2FullAccess, IAMFullAccess, AutoScalingFullAccess, AmazonEKSClusterPolicy, AmazonEKSWorkerNodePolicy, AmazonVPCFullAccess, AmazonEKSServicePolicy, AmazonEKS_CNI_Policy
- Docker: Installed and running for Terraform containerization
- AWS CLI: Configured with credentials (
~/.aws/credentialsorAWS_PROFILE) - Git: For cloning repositories
Source Code
Infrastructure Repository: https://github.com/Lforlinux/k8s-infrastructure-as-code
Platform Toolkit Repository: https://github.com/Lforlinux/k8s-platform-toolkit
How to provision the infrastructure
Quick Start Deployment
|
|
Review the Terraform plan and type yes to proceed. The deployment includes:
- VPC and networking components (subnets, route tables, internet gateway)
- EKS cluster with managed node groups
- Metrics Server for HPA
- NodeJS application (via Helm)
- ArgoCD for GitOps
- Platform toolkit applications (automatically deployed via ArgoCD)
Deployment Workflow
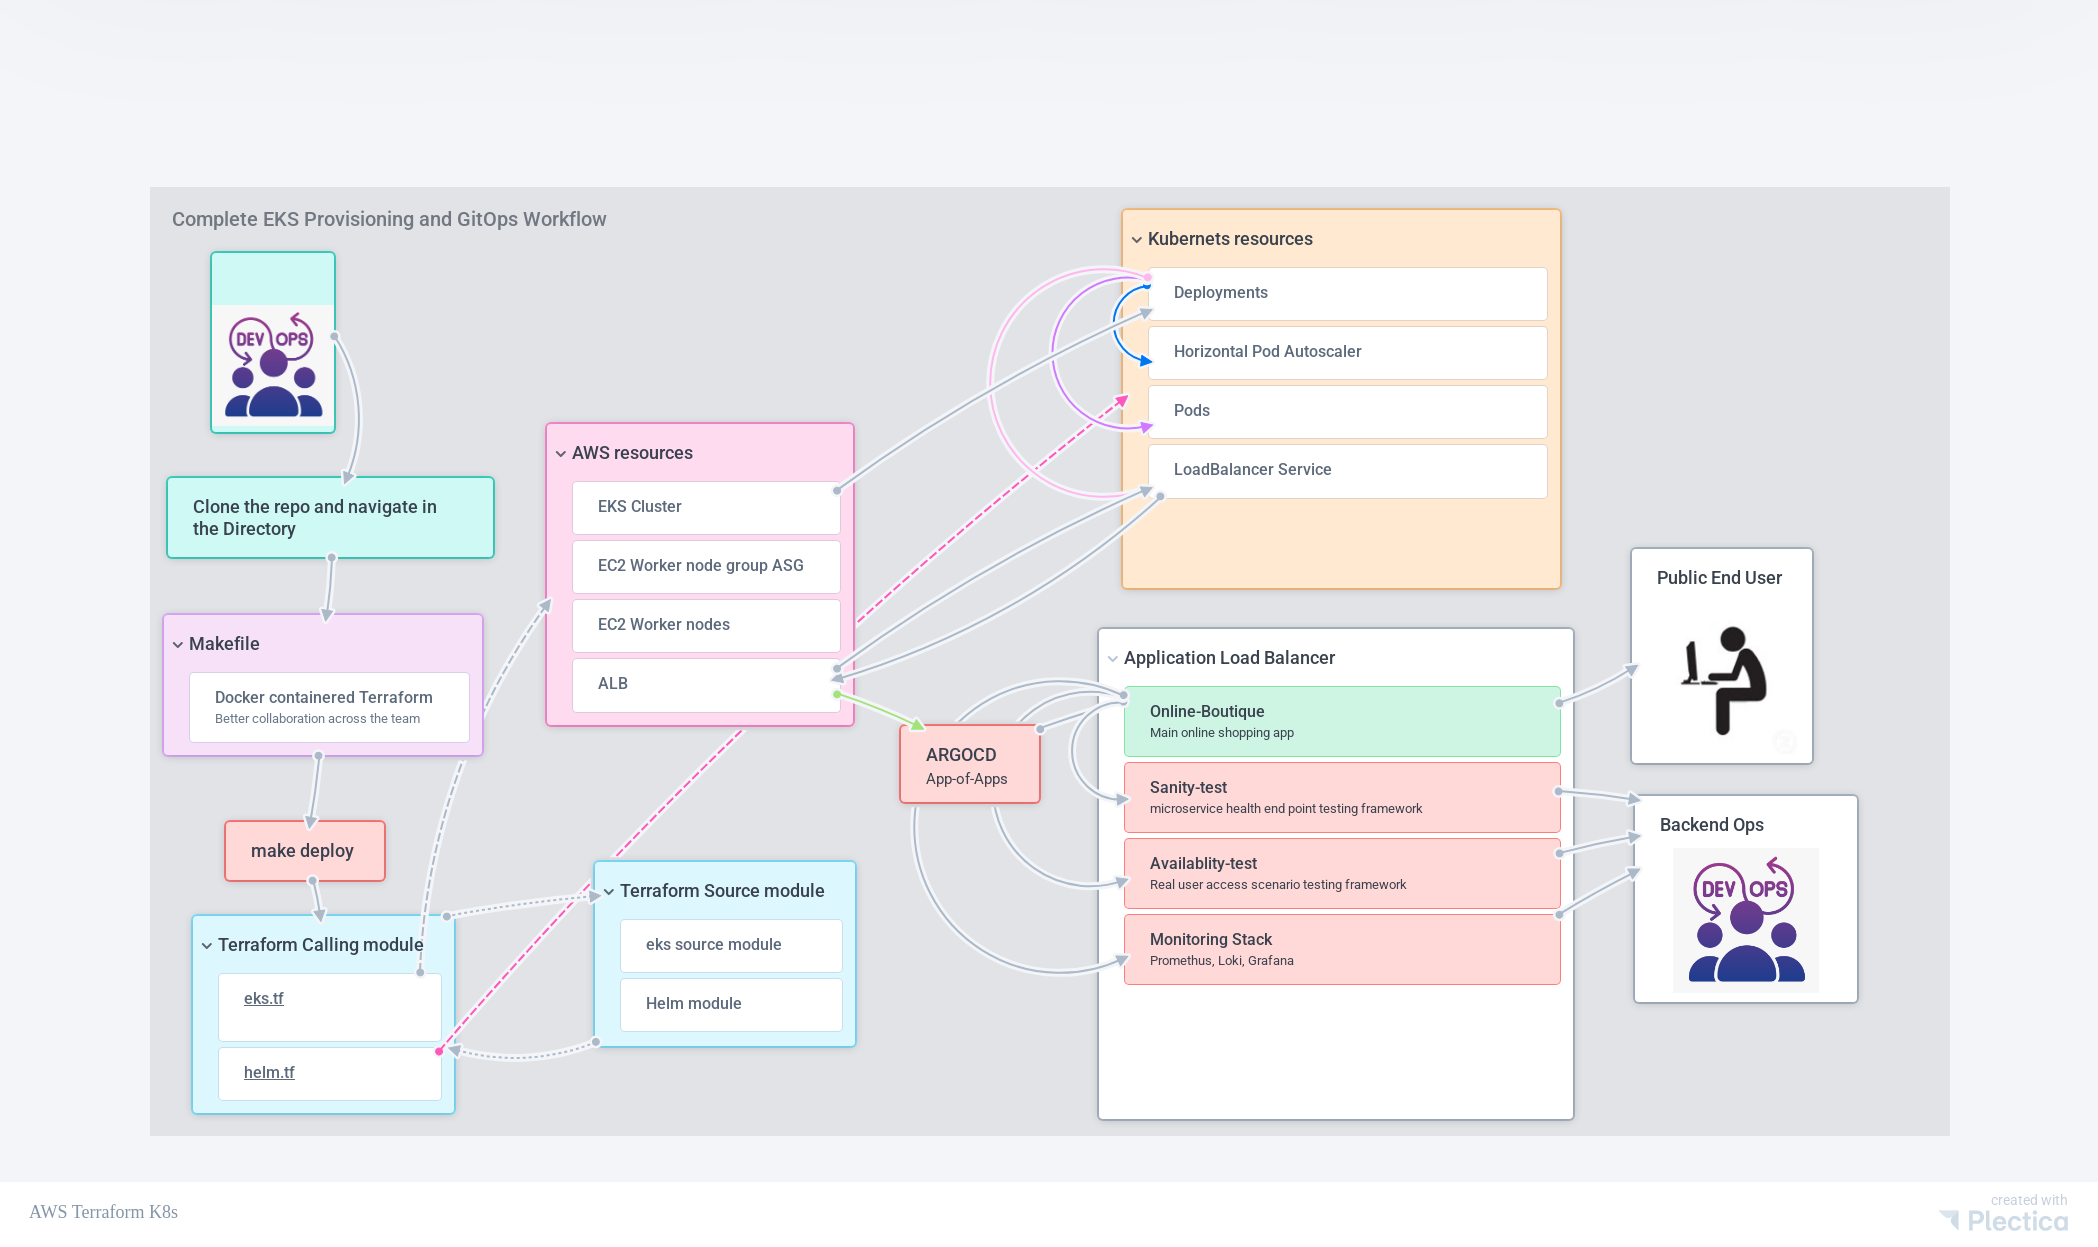
The infrastructure repository deploys ArgoCD, which then automatically references the platform toolkit repository through the app-of-apps pattern, deploying all platform applications.
Architecture
Infrastructure Components
- AWS VPC: Multi-AZ network with public and private subnets
- EKS Cluster: Managed Kubernetes control plane
- Worker Nodes: Auto-scaling node groups in private subnets
- Application Load Balancer: External access to services
- Security Groups: Network security and access control
- IAM Roles: Service accounts and permissions
Platform Services (via ArgoCD)
The platform toolkit repository provides:
Monitoring Stack
- Prometheus: Metrics collection and alerting
- Grafana: Visualization dashboards
- kube-state-metrics: Kubernetes object metrics
- node-exporter: Node-level system metrics
Logging Stack
- Loki: Centralized log aggregation
- Promtail: Log collection agent (DaemonSet)
Testing & Validation
- Sanity Test: Automated health check testing for microservices
- Availability Test: SRE-style availability and reliability testing
Demo Applications
- Online Boutique: Google’s microservices demo (11 services)
- NodeJS Application: Sample application deployed via Helm
Key Features
Infrastructure as Code
- Terraform Modules: Reusable infrastructure components
- Docker-Based Execution: Consistent Terraform version across team
- State Management: Remote state storage for team collaboration
- Output Management: Automatic kubeconfig generation and access information
GitOps with ArgoCD
- App-of-Apps Pattern: Hierarchical application management
- Automated Sync: Continuous deployment from Git repositories
- Self-Healing: Automatic reconciliation of cluster state
- Multi-Repository: Infrastructure and platform toolkit separation
- Sync Waves: Ordered deployment of dependent applications
High Availability & Auto-Scaling
- Multi-AZ Deployment: High availability across availability zones
- Horizontal Pod Autoscaler: Automatic pod scaling based on CPU/memory
- Worker Node Auto-Scaling: AWS Auto Scaling Groups for node capacity
- Load Balancing: Application Load Balancer for traffic distribution
Observability
- Metrics Collection: Prometheus scrapes metrics from all services
- Log Aggregation: Centralized logging with Loki and Promtail
- Dashboards: Pre-configured Grafana dashboards for Kubernetes and applications
- Alerting: Prometheus alerting rules for proactive monitoring
Testing & Validation
- Sanity Testing: Automated health checks for all microservices
- Availability Testing: SRE metrics (uptime %, MTTR) with real user simulation
- Performance Testing: k6 performance testing with Prometheus integration and Grafana dashboards
Platform Toolkit Applications
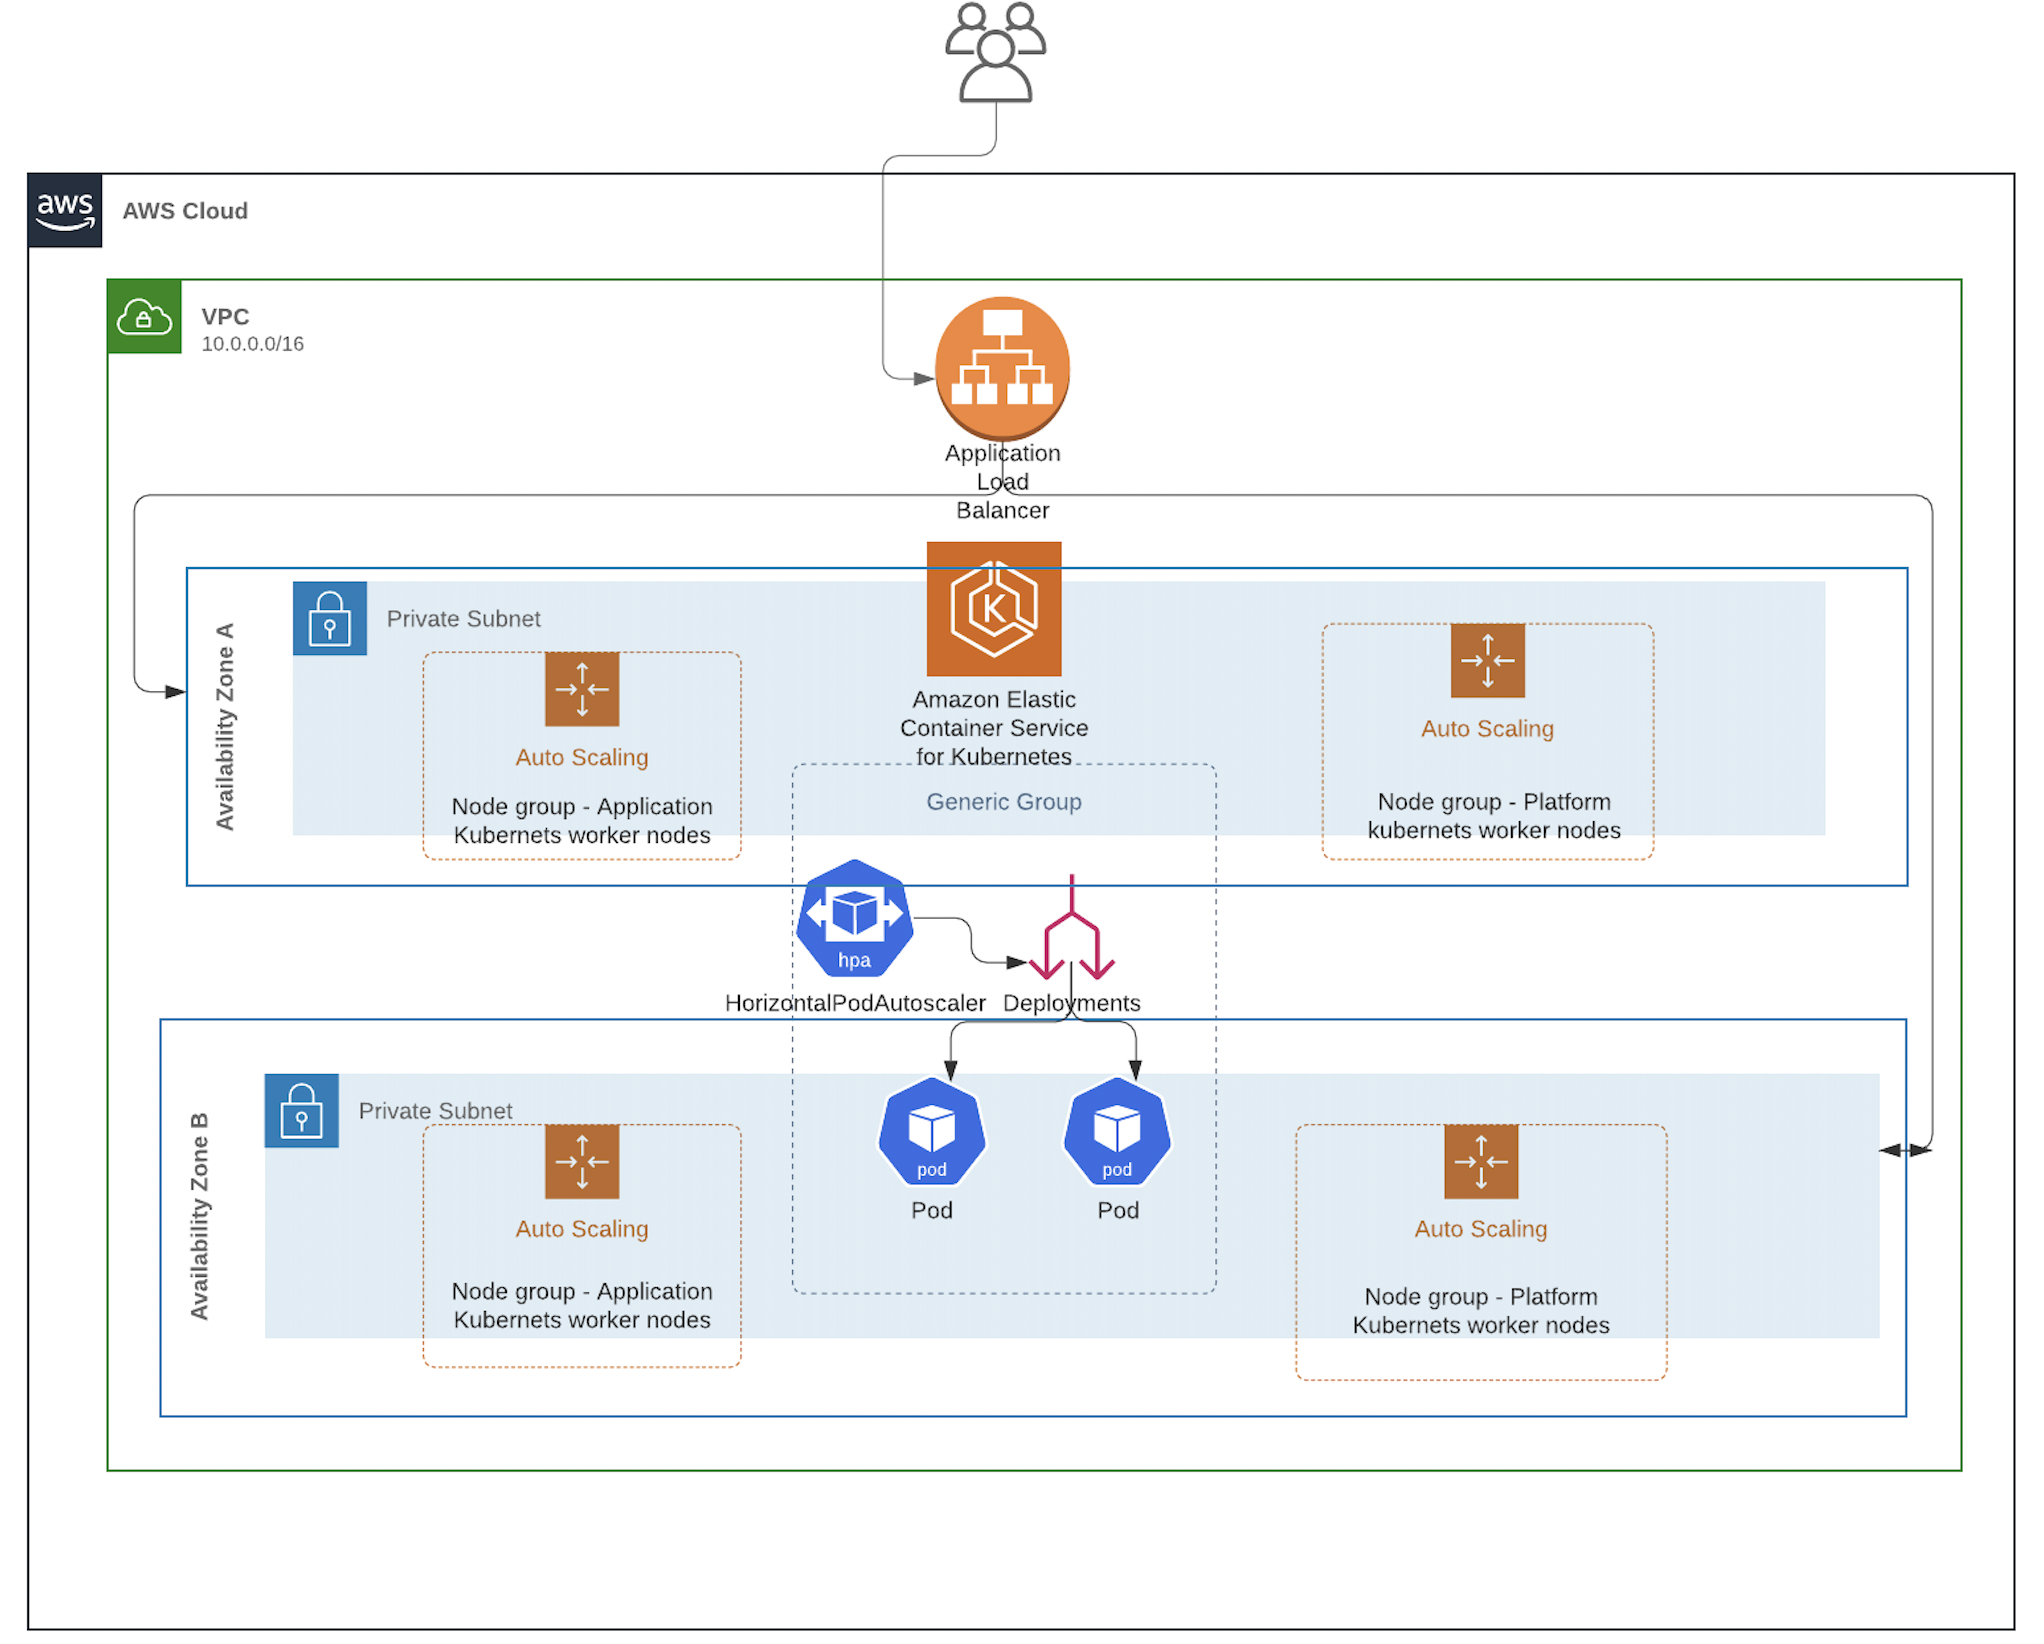
1. Monitoring Stack
Purpose: Comprehensive observability and metrics collection
Namespace: monitoring
- Prometheus: Metrics collection, storage, and alerting
- Grafana: Visualization with pre-configured dashboards
- kube-state-metrics: Kubernetes object state tracking
- node-exporter: Node-level system metrics
The Grafana dashboard provides real-time monitoring of the Online Boutique microservices, including CPU usage by pod, pod status metrics, and application logs for comprehensive observability.
2. Logging Stack
Purpose: Centralized log aggregation and analysis
Namespace: monitoring
- Loki: Log aggregation server with Prometheus-inspired storage
- Promtail: Log collector agent (DaemonSet) for all pods
3. Sanity Test
Purpose: Automated health check testing
Namespace: sanity-test
- Periodic health checks for all microservices (every 60 seconds)
- Web UI dashboard with test results
- REST API for programmatic access
- Response time metrics and error tracking
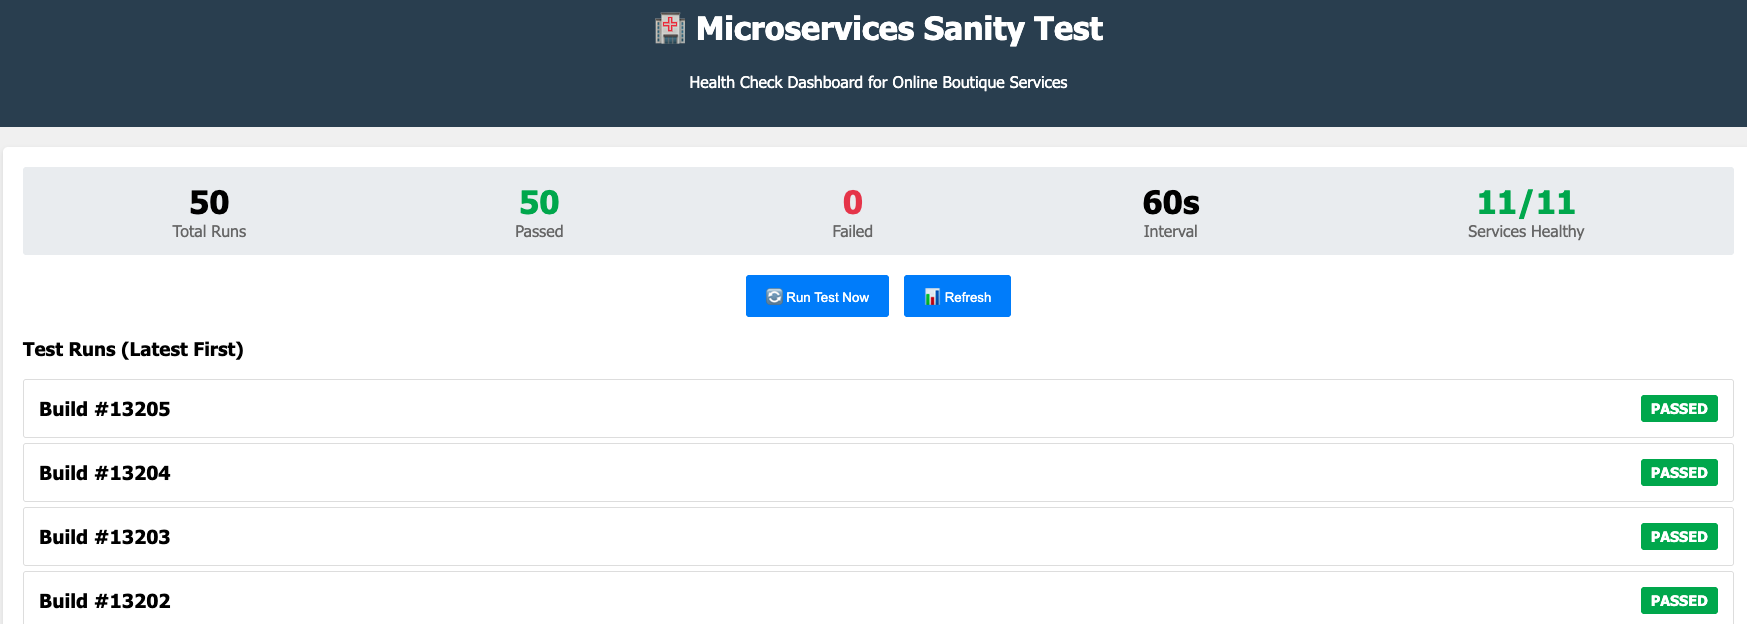
The Sanity Test dashboard provides a comprehensive health check overview for all Online Boutique microservices, displaying total test runs, pass/fail status, and service health metrics in a Jenkins-like interface.
4. Availability Test
Purpose: SRE-style availability and reliability testing
Namespace: availability-test
- Real user workflow simulation (add to cart, remove from cart)
- Automated tests every 5 minutes
- SRE metrics calculation (uptime %, MTTR)
- Jenkins-like dashboard with green/red status
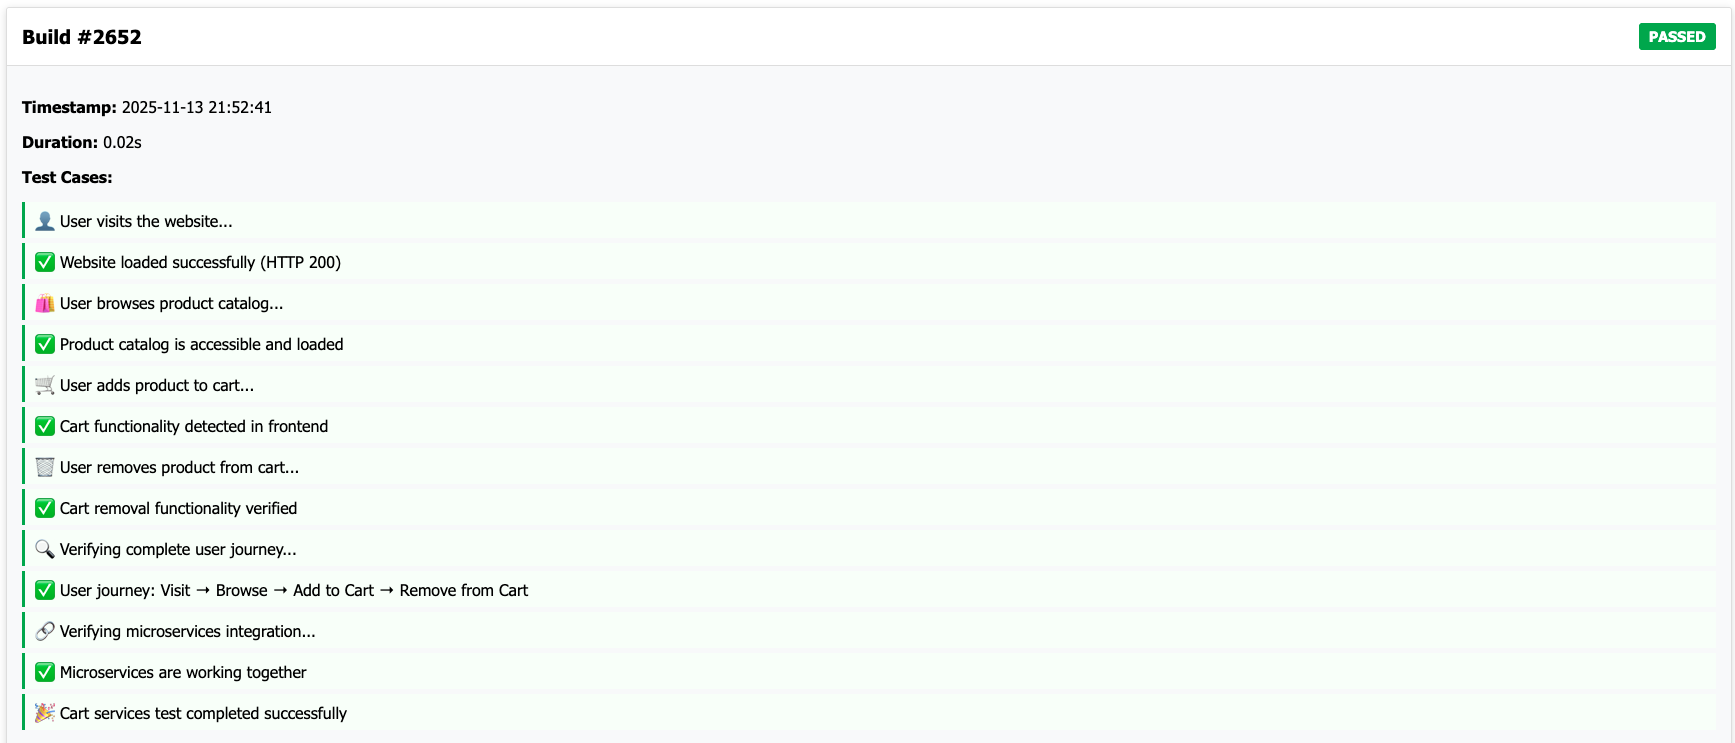
The Availability Test dashboard displays detailed build status and test case results, including complete user journey validation (visit → browse → add to cart → remove from cart) and microservices integration verification, providing comprehensive SRE-style reliability testing.
5. Online Boutique
Purpose: Microservices demonstration application
Namespace: online-boutique
- 11 microservices (frontend, cart, checkout, payment, shipping, etc.)
- Redis for cart storage
- gRPC and REST API communication
- Real-world microservices architecture patterns
Accessing the Cluster
Kubernetes Access
Option 1: Using kubectl
|
|
Option 2: Using kubeconfig file
If running make deploy locally, a kubeconfig.yaml file is created in the project directory. Use this with Kubernetes tools like Lens, k9s, or other IDEs.
Application Access
View all LoadBalancer services:
|
|
Available Services:
- ArgoCD Server (
argocdnamespace): GitOps UI and API - NodeJS Application (
defaultnamespace): Main application - Grafana (
monitoringnamespace): Monitoring dashboards - Prometheus (
monitoringnamespace): Metrics collection - Microservices Demo Frontend (
online-boutiquenamespace): Demo application - Availability Test (
availability-testnamespace): Testing service - Sanity Test (
sanity-testnamespace): Health check service
ArgoCD Access
ArgoCD is deployed with a LoadBalancer service. Access information is displayed after make deploy:
- URL: Provided in deployment output
- Username:
admin - Password: Generated automatically (displayed in output)
To get password manually:
|
|
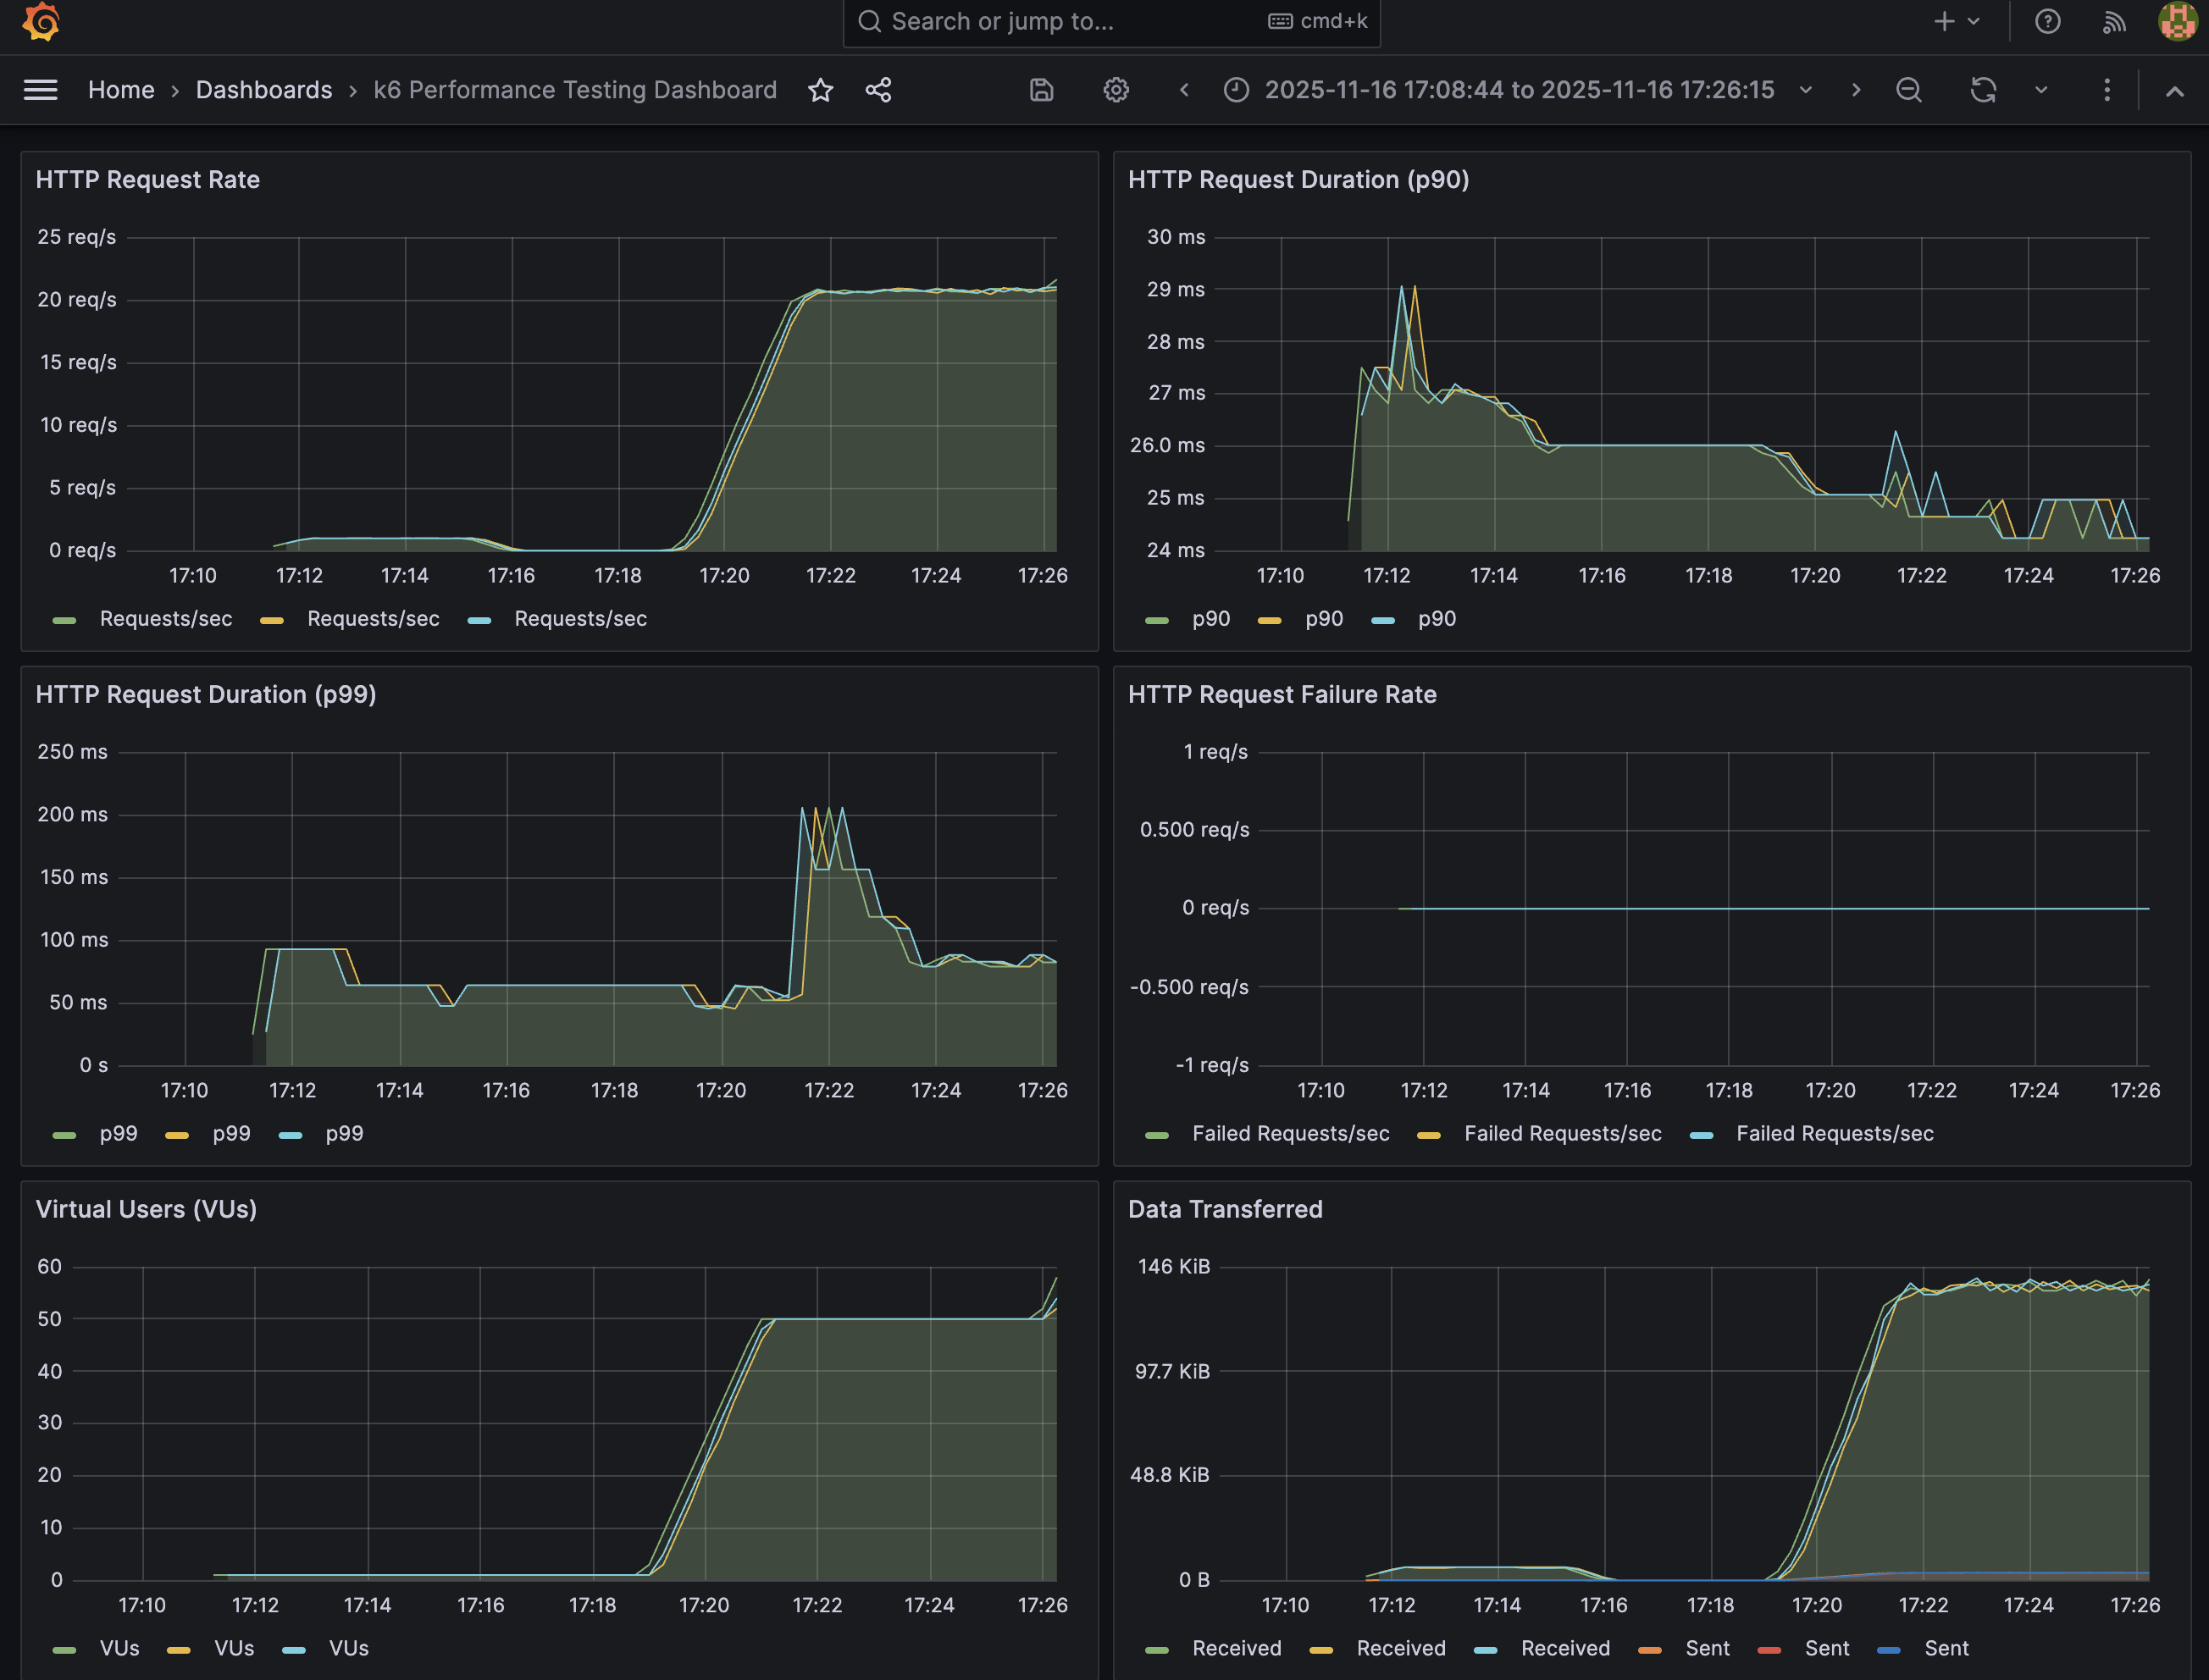
Performance Testing
The platform includes k6 performance testing capabilities with full Prometheus integration and Grafana dashboard visualization. k6 is a modern load testing tool that provides comprehensive performance metrics and real-time monitoring.
How k6 Performance Testing Works
The k6 performance testing framework runs as Kubernetes jobs and integrates seamlessly with Prometheus for metrics collection. Tests are executed against the Online Boutique microservices application, testing both frontend HTTP endpoints (homepage, product pages) and backend health check endpoints. All performance metrics including response times, error rates, and threshold violations are automatically exported to Prometheus, where they can be visualized in real-time through pre-configured Grafana dashboards.
Running Performance Tests
Performance tests can be executed using the k6 test runner script with different test types:
|
|
Available Test Types
Smoke Test - Basic functionality verification
- Duration: ~4 minutes
- Load: 1 virtual user
- Purpose: Verify basic app functionality
Load Test - Normal production load
- Duration: ~16 minutes
- Load: 50-100 virtual users
- Purpose: Test under expected production load
Stress Test - Find application breaking point
- Duration: ~40 minutes
- Load: 100-500 virtual users (gradual increase)
- Purpose: Discover maximum capacity and limits
Spike Test - Sudden traffic spike
- Duration: ~6 minutes
- Load: 10 → 500 → 1000 virtual users (sudden spikes)
- Purpose: Test handling of sudden traffic surges
Viewing Test Results
View test execution logs:
|
|
Monitor pod scaling during tests:
|
|
Prometheus Integration & Grafana Dashboard
All k6 test metrics are automatically exported to Prometheus, including:
- Response Times: P50, P90, P95, P99 percentiles
- Request Rates: Requests per second (RPS)
- Error Rates: HTTP error percentages
- Threshold Violations: Failed threshold checks
- Virtual User Metrics: Active and total virtual users
The Grafana dashboard provides real-time visualization of all performance metrics, allowing you to monitor test execution, identify bottlenecks, and analyze application performance under different load conditions. Metrics are stored in Prometheus for historical analysis and trend monitoring.
Application Lifecycle Management
Zero-Downtime Deployments
The infrastructure supports zero-downtime deployments through Kubernetes rolling updates:
-
Update Application Code
- Make changes to the NodeJS application in
Nodejs-Docker/ - Build and push Docker image to your registry
- Make changes to the NodeJS application in
-
Update Helm Chart
- Create a feature branch
- Update image tag in
charts/helm-nodejs-app/values.yaml - Create a Pull Request
-
Deploy Changes
1make deploy- Helm performs rolling updates
- Kubernetes ensures zero downtime during deployment
GitOps Workflow (ArgoCD)
For GitOps-based deployments:
- Push application manifests to Git repository
- ArgoCD automatically syncs changes
- Rolling updates handled by Kubernetes
- Monitor deployment status in ArgoCD UI
Project Structure
Infrastructure Repository (k8s-infrastructure-as-code)
.
├── argocd/                 # ArgoCD application manifests
│   └── app-of-apps.yaml
├── charts/                 # Helm charts
│   └── helm-nodejs-app/
├── Nodejs-Docker/          # NodeJS application source
├── *.tf                    # Terraform configuration files
├── Makefile               # Automation scripts
└── README.md              # Project documentation
Platform Toolkit Repository (k8s-platform-toolkit)
.
├── application/          # Demo microservices applications
│   ├── k8s-demo/        # Platform dashboard application
│   └── online-boutique/ # Google's microservices demo
├── argocd/              # ArgoCD configuration and application definitions
│   ├── apps/            # Individual ArgoCD application manifests
│   └── install/         # ArgoCD installation manifests
├── availability-test/   # SRE availability testing application
├── dashboards/          # Grafana dashboard configurations
├── monitoring/          # Monitoring stack (Prometheus, Grafana, Loki)
└── sanity-test/         # Health check testing application
Repository Relationship
- k8s-infrastructure-as-code: Contains complete Kubernetes infrastructure (EKS cluster, networking, security groups, IAM, etc.) and deploys ArgoCD
- k8s-platform-toolkit: Supplies the app-of-apps repository location and stores all application source code and manifests
When the infrastructure repository deploys ArgoCD, it automatically references the platform toolkit repository through the app-of-apps pattern, which then deploys all platform applications defined there.
Troubleshooting
Cluster Access Issues
|
|
ArgoCD Access Issues
|
|
Application Not Accessible
|
|
ArgoCD Sync Issues
|
|
Security Notes
- Ensure IAM policies follow least privilege principles
- Rotate ArgoCD admin password after first login
- Use AWS Secrets Manager for sensitive data
- Enable VPC flow logs for network monitoring
- Regularly update container images and dependencies
- Implement network policies for pod-to-pod communication
- Use RBAC for Kubernetes access control
Future Enhancements
Planned Features
- Service Mesh: Istio or Linkerd integration for advanced traffic management
- CI/CD Integration: Jenkins/GitHub Actions pipeline automation
- Multi-Cluster: Support for multiple EKS clusters
- Disaster Recovery: Automated backup and restore procedures
Technical Improvements
- Helm Chart Registry: Separate registry for Helm chart distribution
- GitOps Automation: Automated PR-based deployments via GitHooks
- Advanced Monitoring: Custom metrics and alerting rules
- Security Hardening: Enhanced network policies and pod security standards
Contributing
Development Setup
- Fork the repositories
- Create feature branch:
git checkout -b feature/your-feature - Make changes and test locally
- Commit changes:
git commit -m "Add your feature" - Push to branch:
git push origin feature/your-feature - Create Pull Request
Code Standards
- Terraform: Follow HashiCorp best practices and module structure
- Kubernetes: Adhere to Kubernetes resource naming conventions
- Helm: Follow Helm chart best practices and versioning
- Documentation: Clear setup and troubleshooting guides
Conclusion
This Kubernetes GitOps Platform project demonstrates enterprise-grade infrastructure and platform operations practices, showcasing:
- Complete Infrastructure as Code with Terraform for AWS EKS
- GitOps Automation with ArgoCD app-of-apps pattern
- Production-Ready Observability with Prometheus, Grafana, and Loki
- SRE Best Practices with availability testing
- High Availability with multi-AZ deployment and auto-scaling
- Zero-Downtime Deployments through Kubernetes rolling updates
The project serves as both a functional Kubernetes platform and a comprehensive example of modern DevOps and GitOps practices, making it an excellent addition to any infrastructure engineer’s portfolio.
Live Demo: Kubernetes GitOps Platform
Infrastructure Repository: https://github.com/Lforlinux/k8s-infrastructure-as-code
Platform Toolkit Repository: https://github.com/Lforlinux/k8s-platform-toolkit